Explore the data
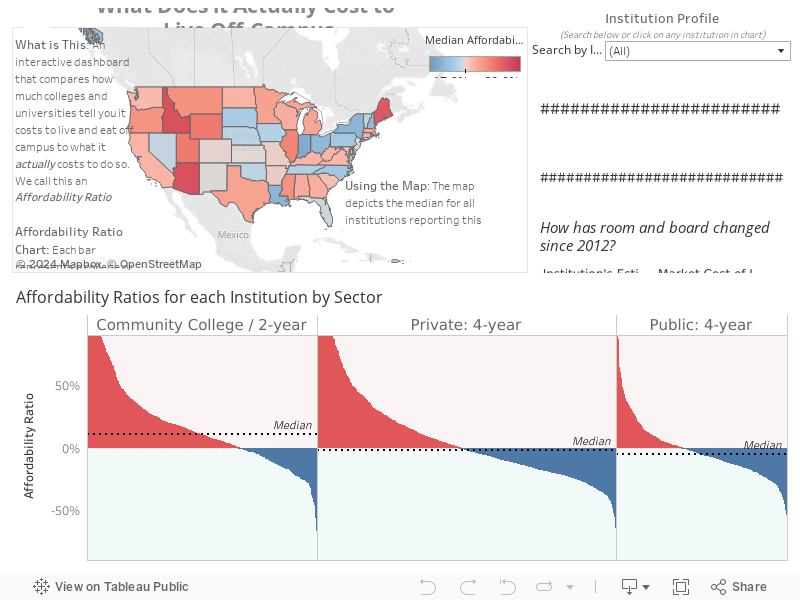
U3 Advisors tracked each school’s estimated cost of living against market data of rents near each respective school. U3 mapped 4,000+ public, not-for-profit and community colleges across the United States and compared them with an estimated cost of housing and food, using data from the Census, Zillow, and Consumer Expenditures Survey.
Schools with a high affordability ratio in red may be underestimating cost of living, and as a result students may not be receiving enough financial aid to cover basic living expenses like housing and food.
Data & Methodology:
The calculated Affordability Ratio is the percentage above or below what an institution estimates that the market requires. U3 calculates market cost of living based on housing cost (median gross rent for a 2-bedroom apartment reported as “per bed”, pro-rated to an academic year for every institution’s zip code) and food cost (annual food expenses by region for people ages 18-25, pro-rated to an academic year). The institution’s estimate is based on IPEDS reported off-campus (not with family) reported cost of room and board for a 9-month academic year.